Running Modal Analysis
This page describes the modal analysis process using Fusion 360. First, the steps to perform the analysis are presented along with a tutorial video. After this, a few of the simulated warped models are observed. Finally, a description of the output data table is provided.
The result of this process is the harmonic content derived from a computer model. The actual output of the process is a table of frequency-vector pairs.
At a high level, the steps are as follows:
- apply material properties to existing model
- apply constraints
- apply mesh settings
- run the simulation
The following is a video of the process:
As shown in the video, a dropdown menu lets us examine how each of the overtones distorts the model.
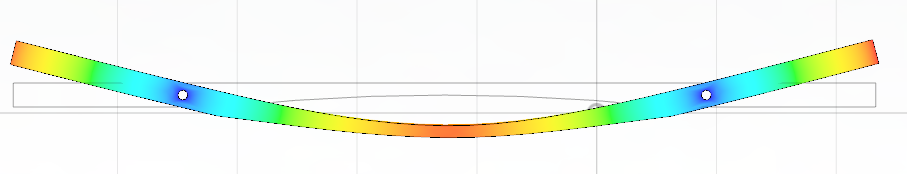
A side view of the fundamental (first) mode of the bar
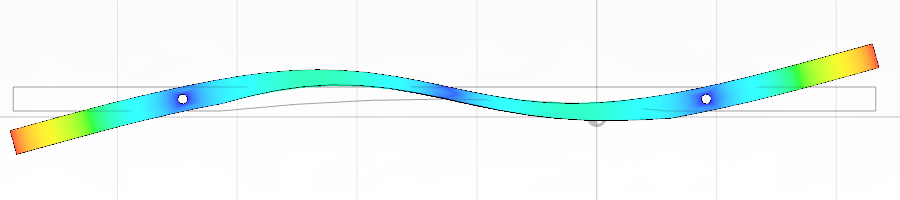
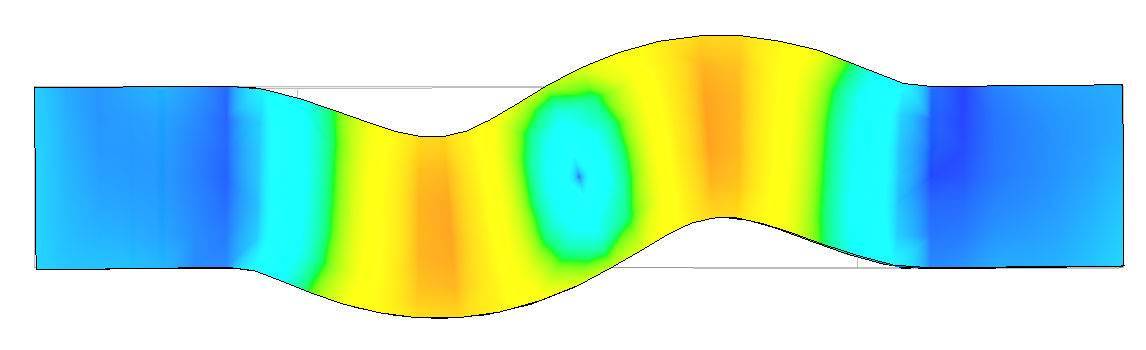
A side view of the first overtone (second mode)
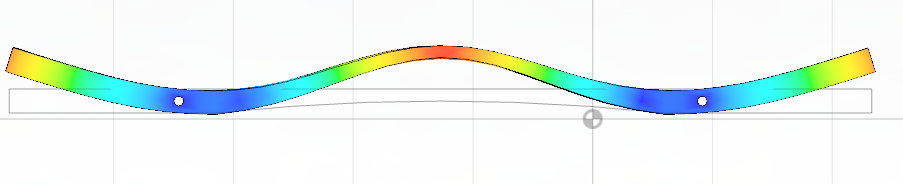
A side view of the second overtone
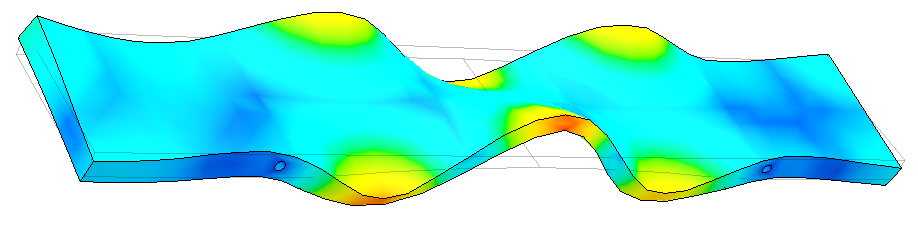
A perspective view of the thirteenth overtone
A top view of the eighteenth overtone
Keep in mind that the displacement here is heavily exaggerated. Otherwise, it would be very hard to see any warpage. Looking through the modes from 1 to 20, it becomes apparent that the force required to deform the model increases. For example, bending the bar to look like mode 19 would be far more difficult than bending it to look like mode 1. This is a good visualization of how harmonic decay occurs in a solid body.
To access the resulting simulation data, click on RESULTS > Report. Check the box next to
the study you wish to see the results for, click Select All, and then click Preview.
This should open a webpage. Navigate down to a section called Result Summary. This is
where the data we are interested in resides. You should see a table with data that looks
something like this:
| Frequency | Participation X | Participation Y | Participation Z |
|---|---|---|---|
| Mode 1: 493.9 Hz | 0.000002114 | 12.6172289 | 0.000000597 |
| Mode 2: 527.4 Hz | 0.030473282 | 0.000940463 | 0.000000345 |
| Mode 3: 1898 Hz | 0.00000109 | 37.5879169 | 0.000035183 |
| Mode 4: 2764 Hz | 0.117449067 | 0.000067549 | 0.000000024 |
| Mode 5: 2977 Hz | 0.000000271 | 0.000085461 | 0.045963418 |
| Mode 6: 4299 Hz | 0.000094173 | 0.058399909 | 0.000035879 |
| Mode 7: 4515 Hz | 0.000006087 | 3.564265 | 0.001703042 |
| Mode 8: 4520 Hz | 0.000129198 | 6.31028861 | 0.000835501 |
The first column contains the frequency for each mode. The other three columns contain the x, y, and z mass participation factors for each mode. Based on these values, we can approximate how loud the harmonic will be in the final waveform. Copy this table and save it in a file like this. Do not include the table header in this file. This is the data file from which the sound wave will be built.